Outline
Note: DATTES 22.06 example. Do not work with DATTES 23.05.
Information about the dataset
The “Second life battery databank” provides the data test results made by Marwan Hassini from Licit-Eco7 laboratory, University Gustave Eiffel during his thesis about second life batteries extracted from real electric vehicles.
This dataset have been used in two publications :
- Second Life Batteries in a Mobile Charging Station : Model Based Performance Assessment
- Second Life Batteries in a Mobile Charging Station : Experimental Performance Assessment
Dataset, test description and data reuse conditions can be found at Univ Gustave Eiffel dataverse
Information about the test
The test is a characterization test performed with a Bitrode FTV250 battery cycler on second life SAMSUNG SDI 94Ah cells.
Data analysis with DATTES
In this example, it is assumed that DATTES is installed on your computer. If it is not the case, please follow these instructions : Getting started.
- First, DATTES must be initialized
% Change the working folder to reach DATTES repository
cd DATTES_folder
% Initialize DATTES
initpath_dattes
- Then, change the working folder to reach second life batteries experimental data.
% Change the working folder to reach experimental data
 cd Second_life_battery_databank
- Convert the Bitrode result files into .xml format
% Convert the Bitrode .csv result files in current folder ('.') into .xml format
bitrode_csv2xml('.')
- Gather all xml files into a single variable
% Search all .xml files in current folder ('.')
XML_list=lsFiles('.','.xml')
- Load the configuration (‘cvs’ = configure + verbose + save)
[result]=dattes(XML_list,'cvs','cfg_SAMSUNG_94Ah')`
- Plot configuration (‘Gc’ = Graphics + configuration):
[result]=dattes(XML_list,'Gc')
- Plot phases (‘Gp’ = Graphics + phases):
[result]=dattes(XML_list,'Gp')
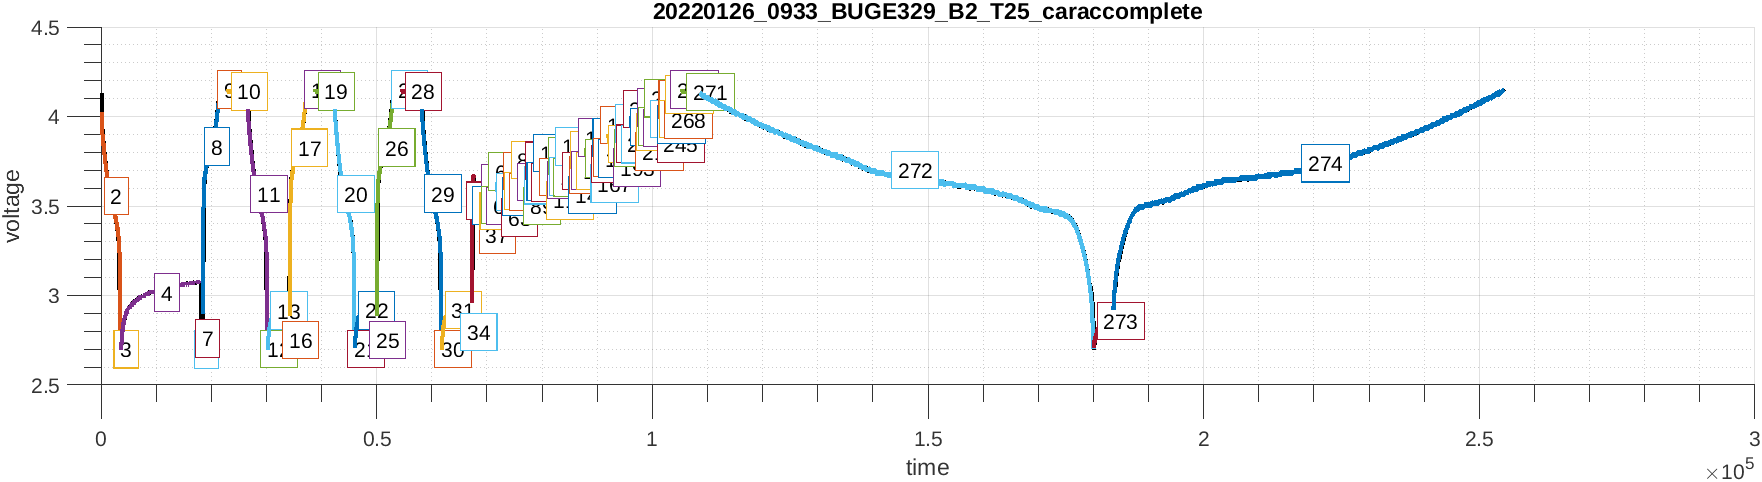
In this plot each phase is numbered and plotted with a different color. DATTES analyzes the test and cut it into phases depending of the cycler working mode (CC, CV, rest, etc.).
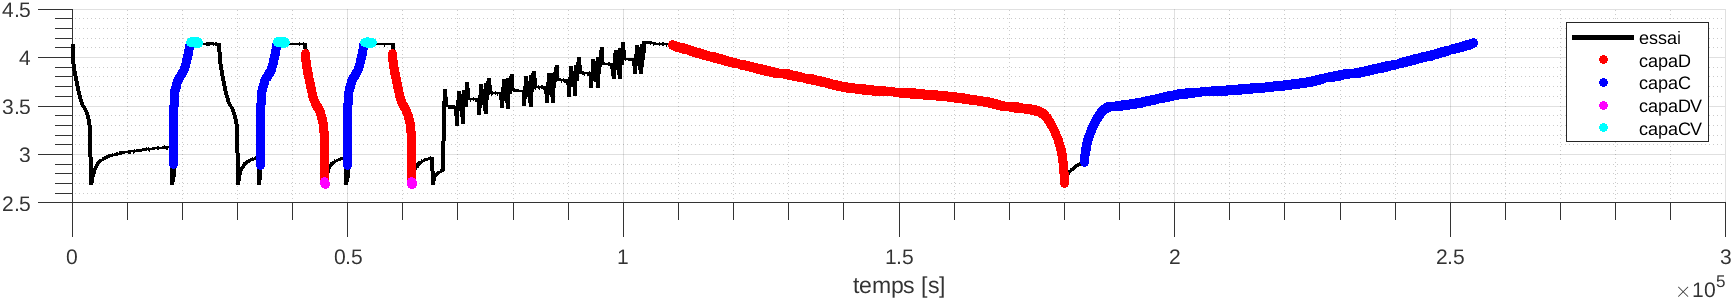
- Calculate capacity and soc (‘CSvs’ = Capacity + SoC + verbose + save)
[result]=dattes(XML_list,'CSvs')
- Plot capacity (‘GC’ = Graphics + Capacity):
[result]=dattes(XML_list,'GC')
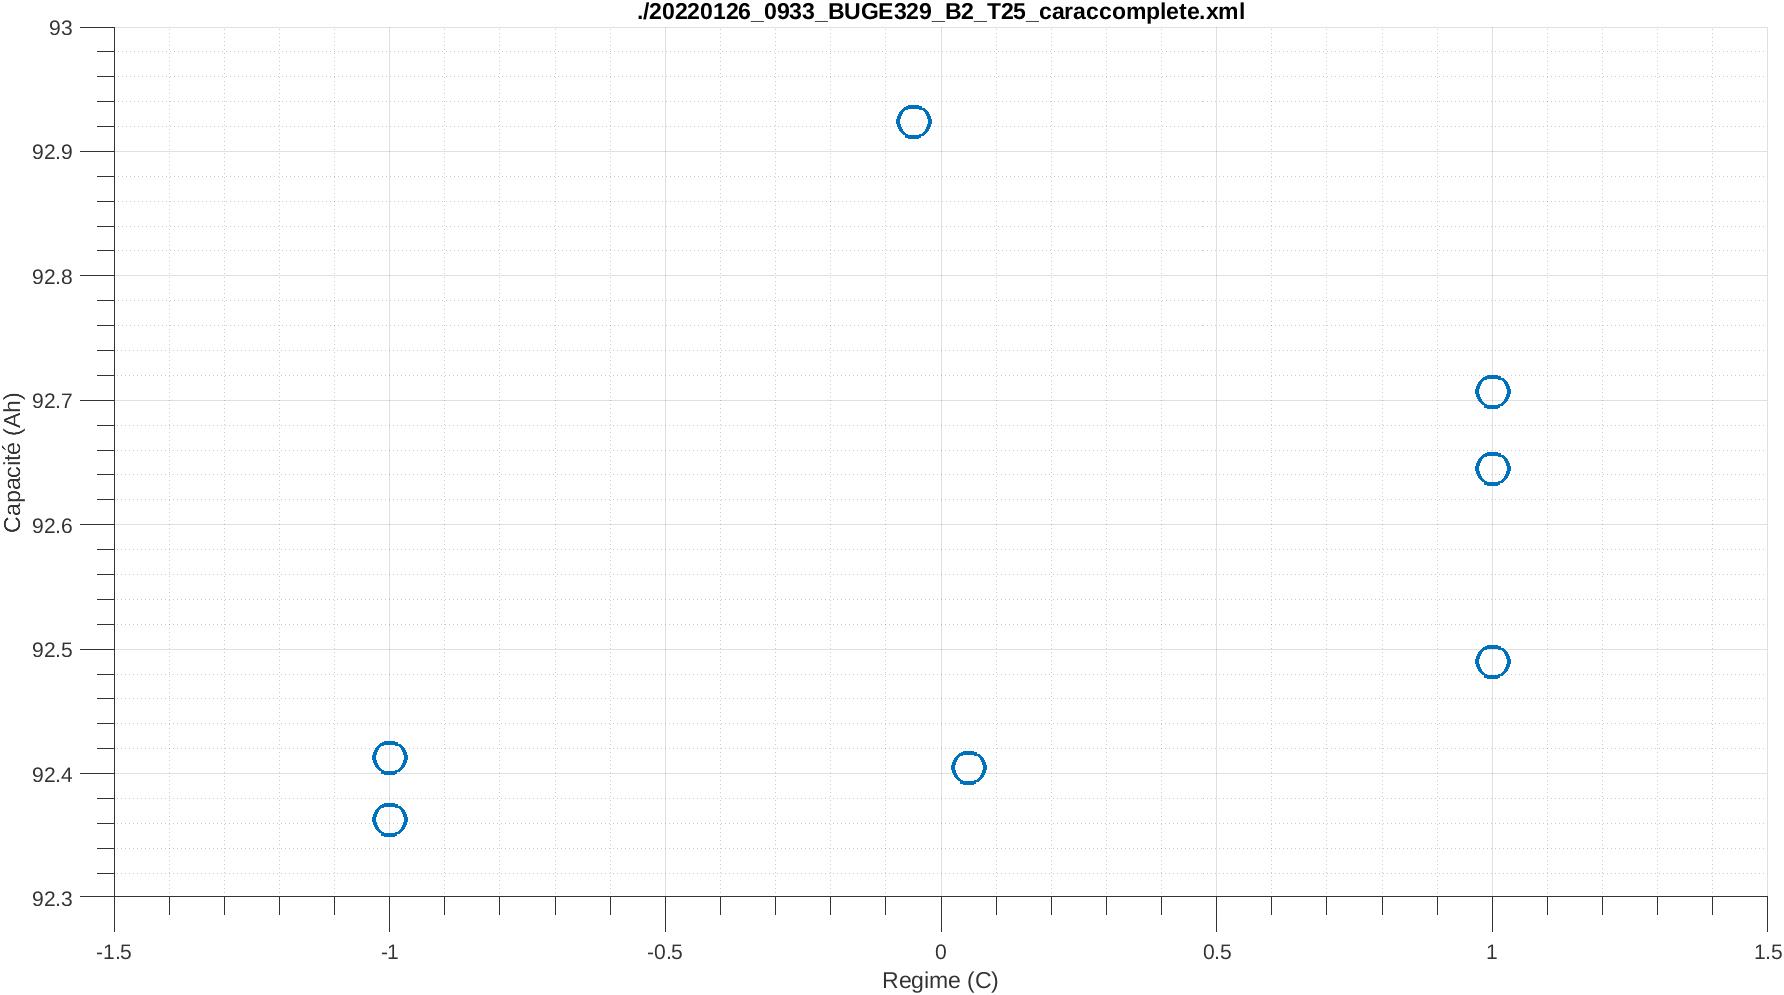
This plot shows different capacity measurements found in this test versus current rate (1C, C/20; charge and discharge). Positive values of current rate correspond to charging phases, negative values of current rate correspond to discharging phases.
- Plot state of charge (‘GS’ = Graphics + Soc):
[result]=dattes(XML_list,'GS')
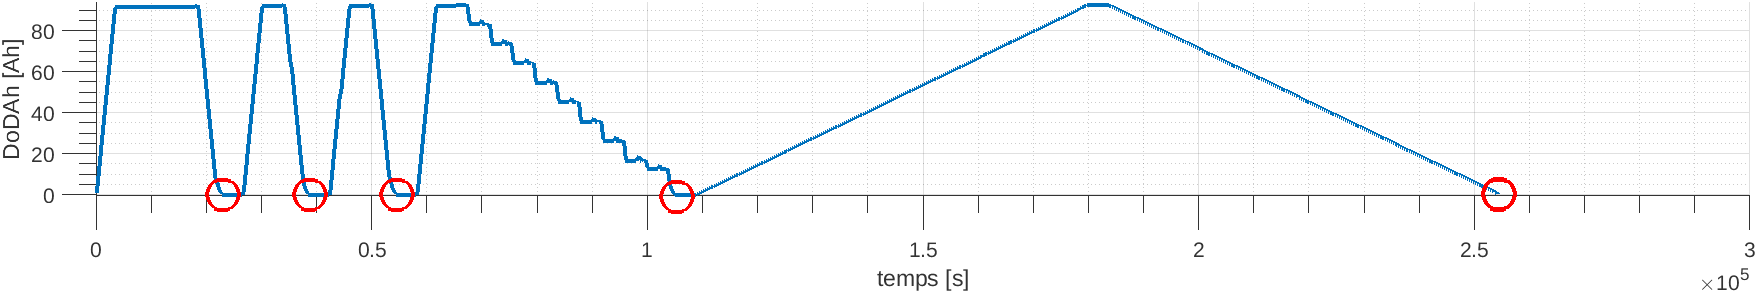 This plot shows depth of discharge (Ah) during test.
Red circles SoC100 points identified by DATTES (SoC reference).
This plot shows depth of discharge (Ah) during test.
Red circles SoC100 points identified by DATTES (SoC reference).
- Calculate the resistance (‘Rvs’ = Resistance + verbose + save):
[result]=dattes(XML_list,'Rvs')
- Plot resistance (‘GR’ = Graphics + Resistance):
[result]=dattes(XML_list,'GR')
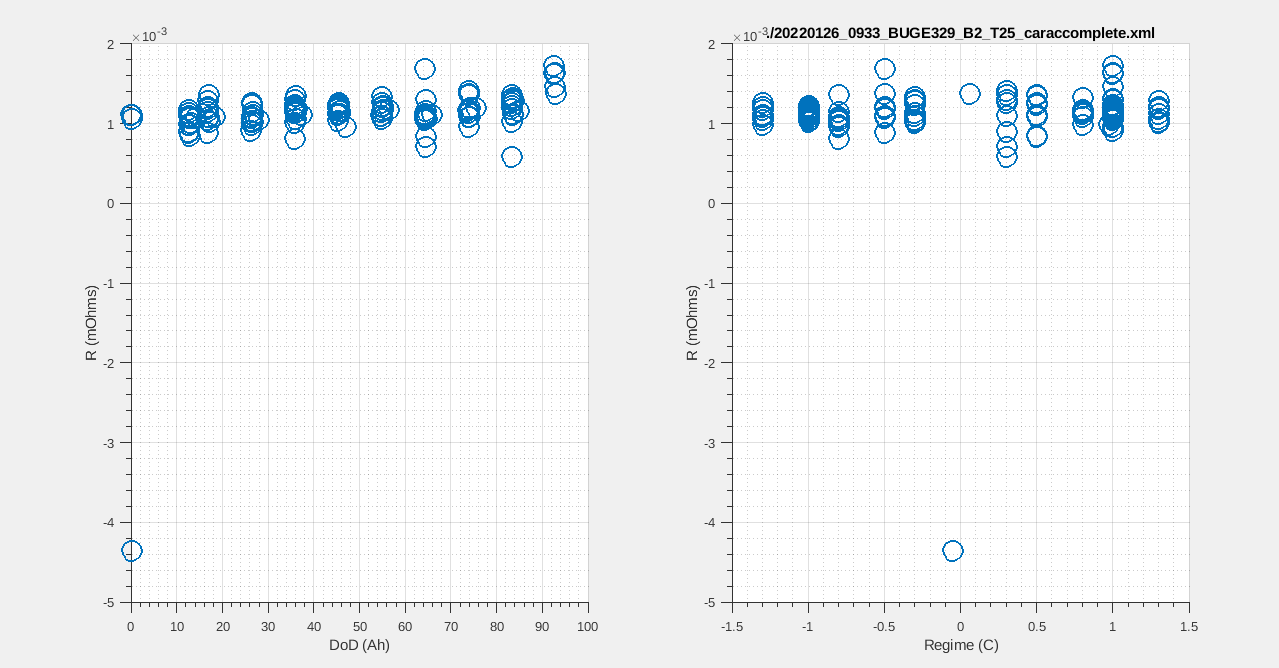
Left subplot shows resistance of different pulses versus depth of discharge (Ah). Right subplot shows resistance of different pulses versus current rate (C).