DATTES will plot your experimental and processed data if you run :
[result, config, phases] = dattes_plot(xml_file,options)
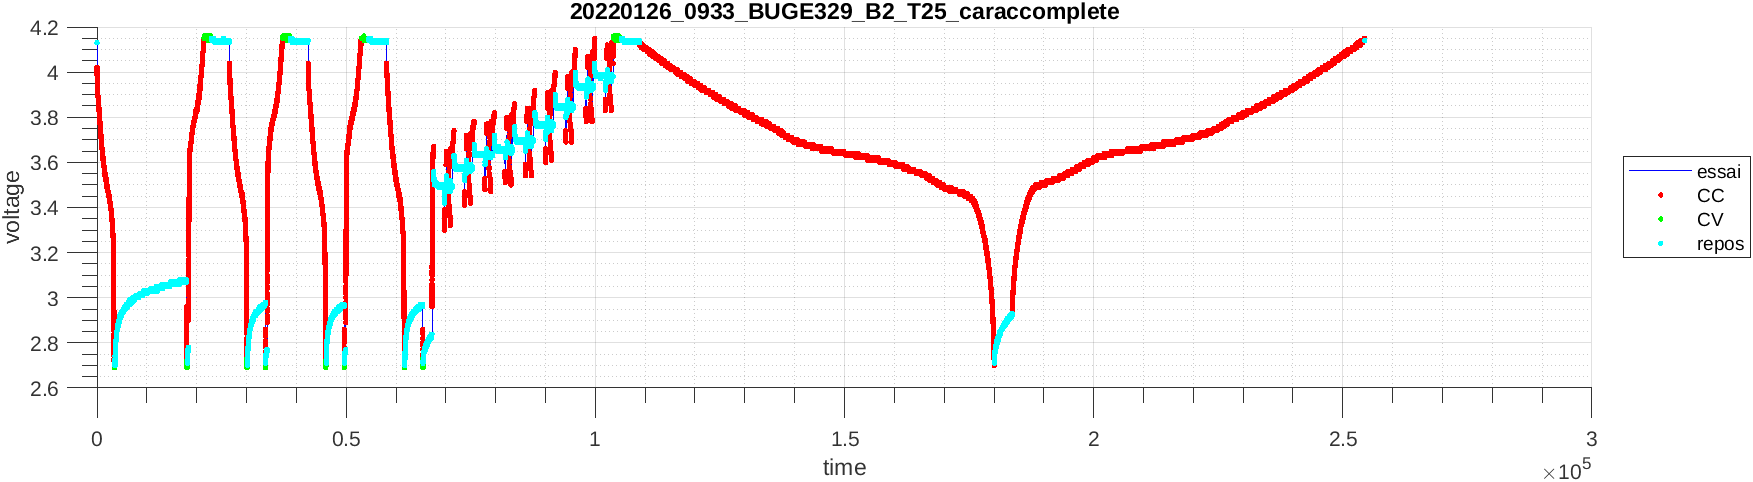
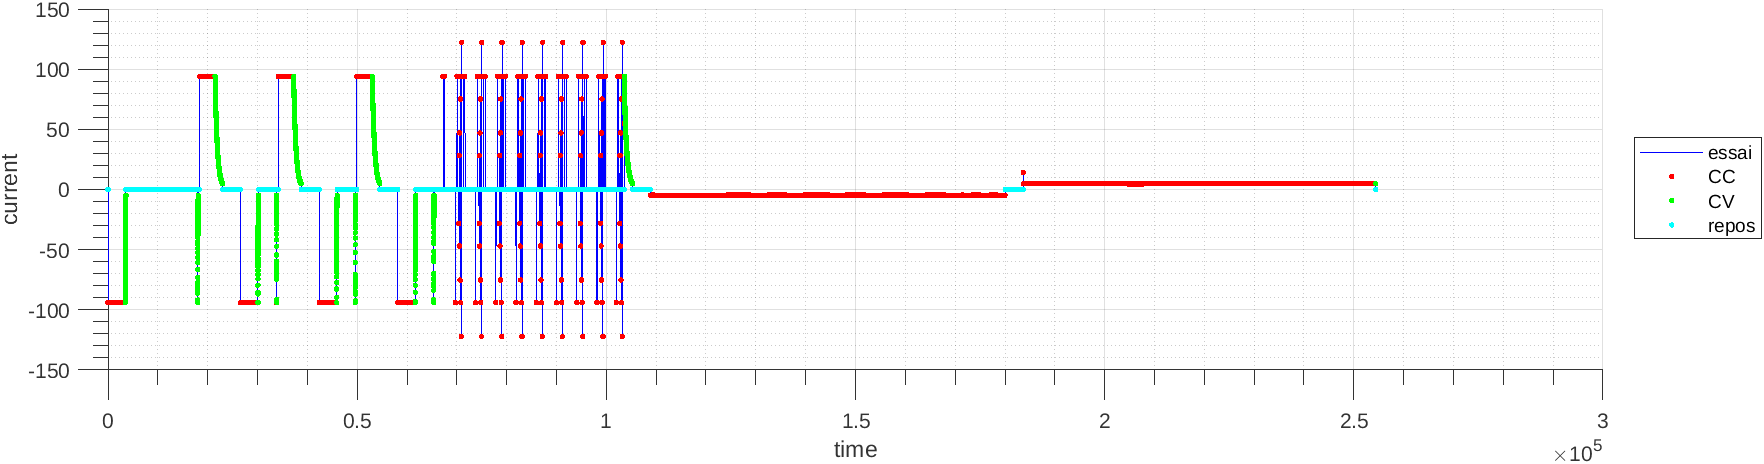
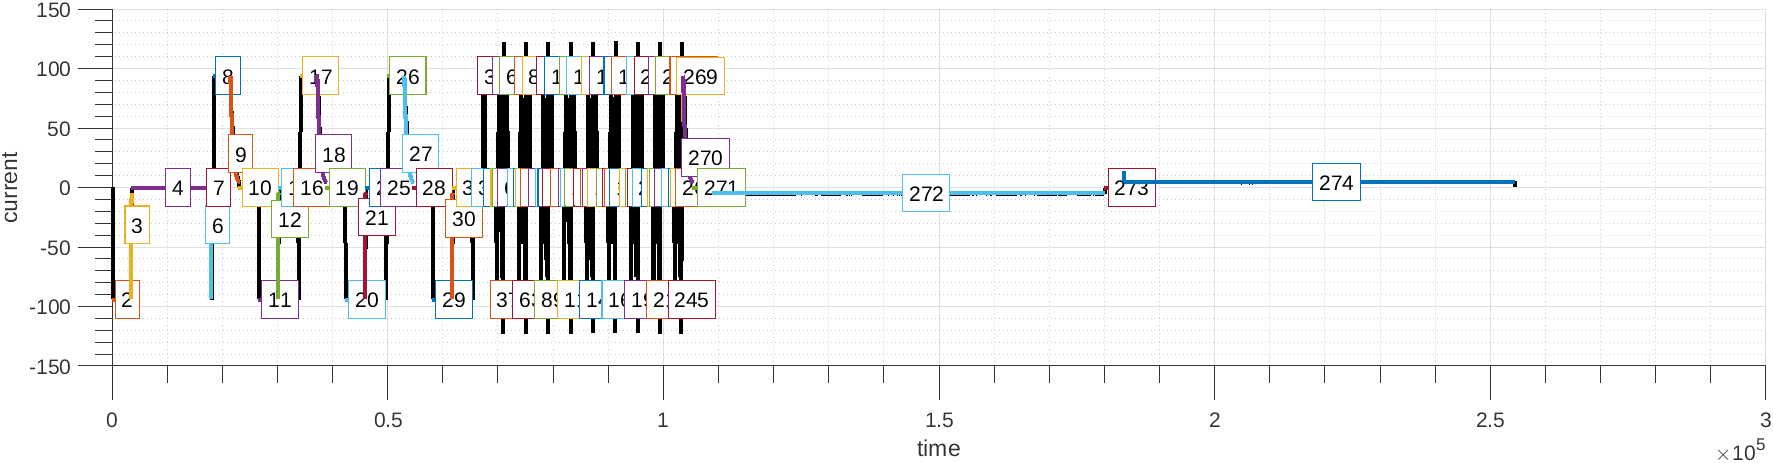
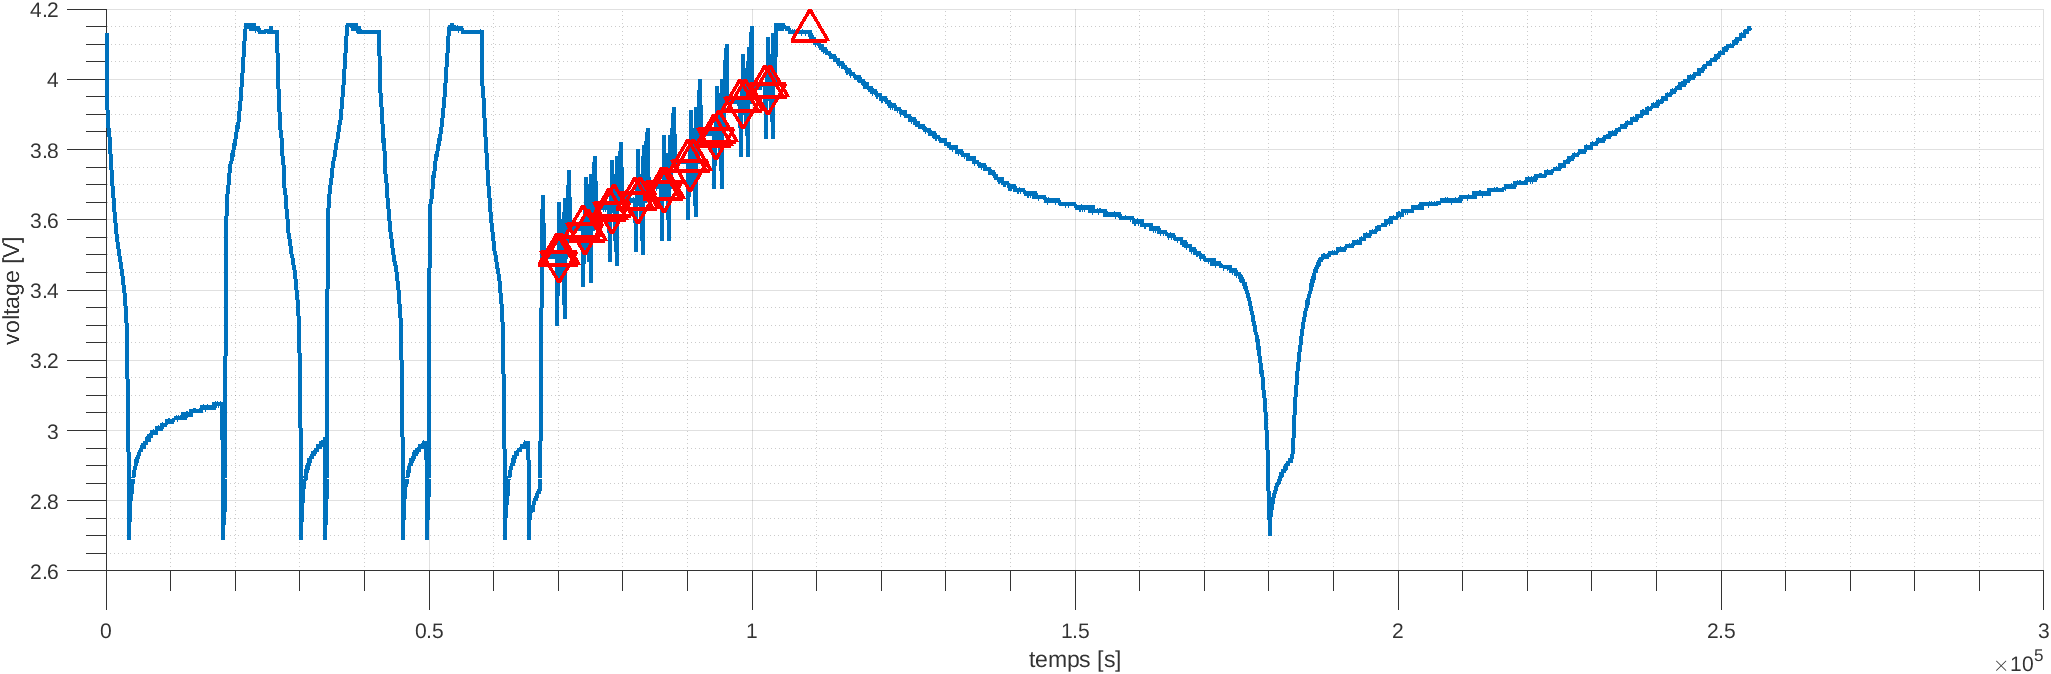
Profiles plot
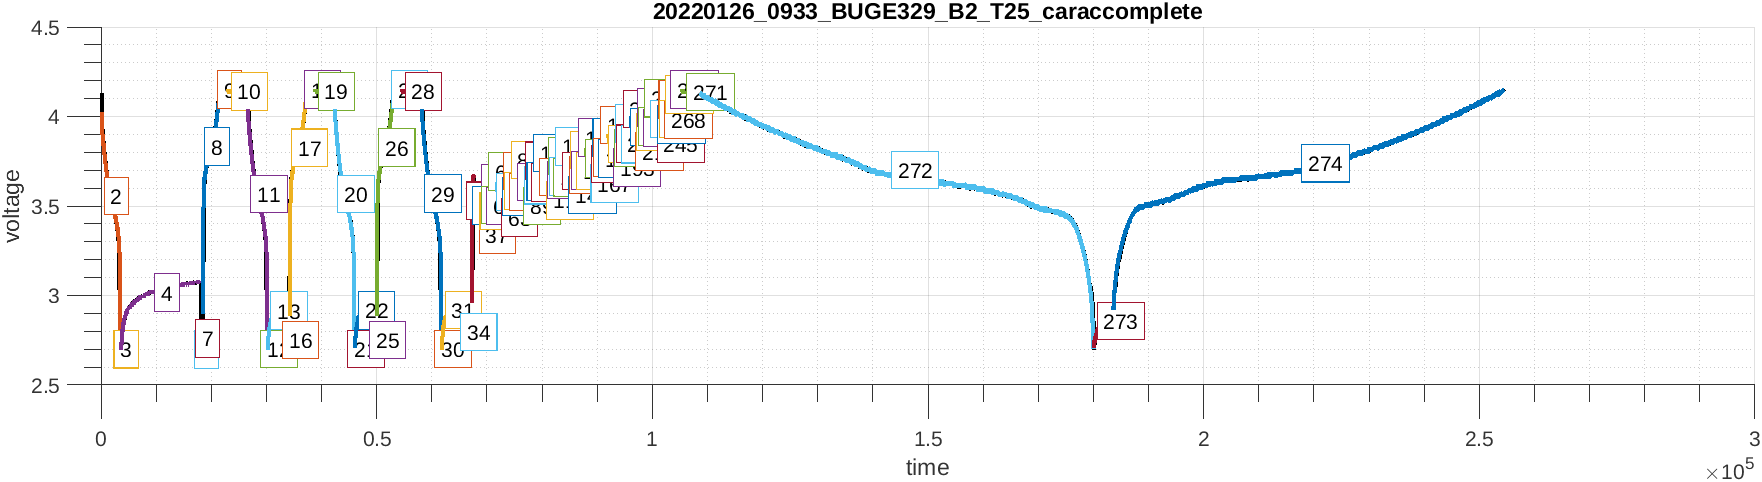
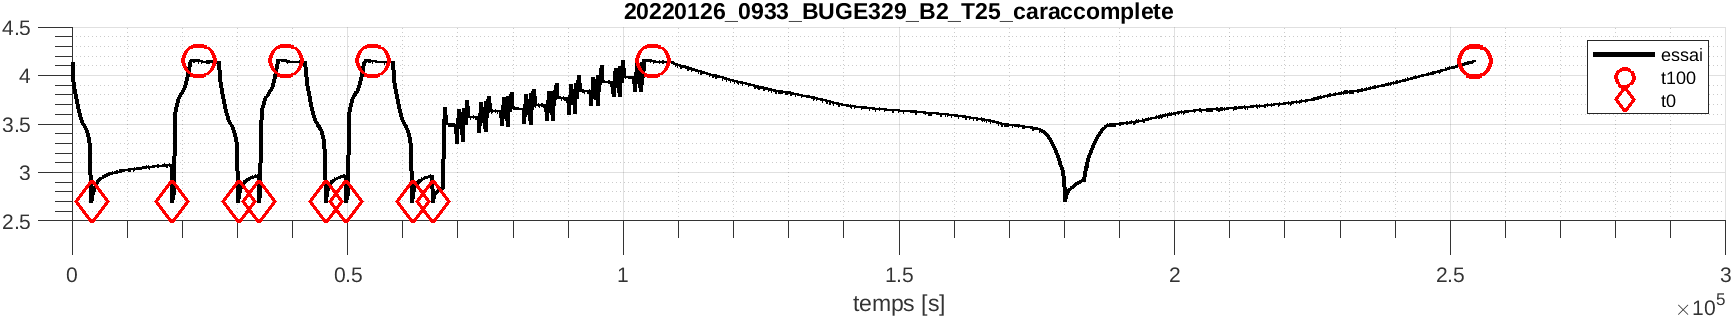
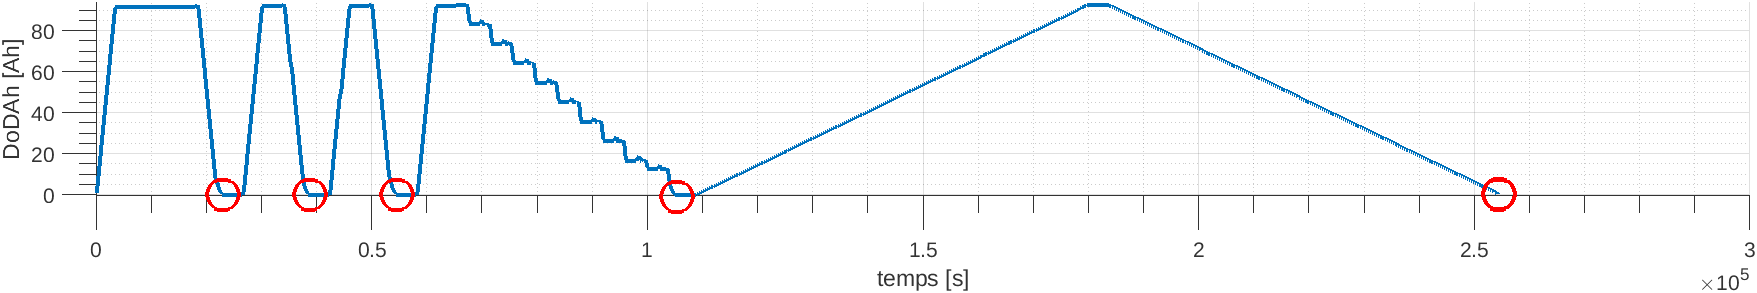
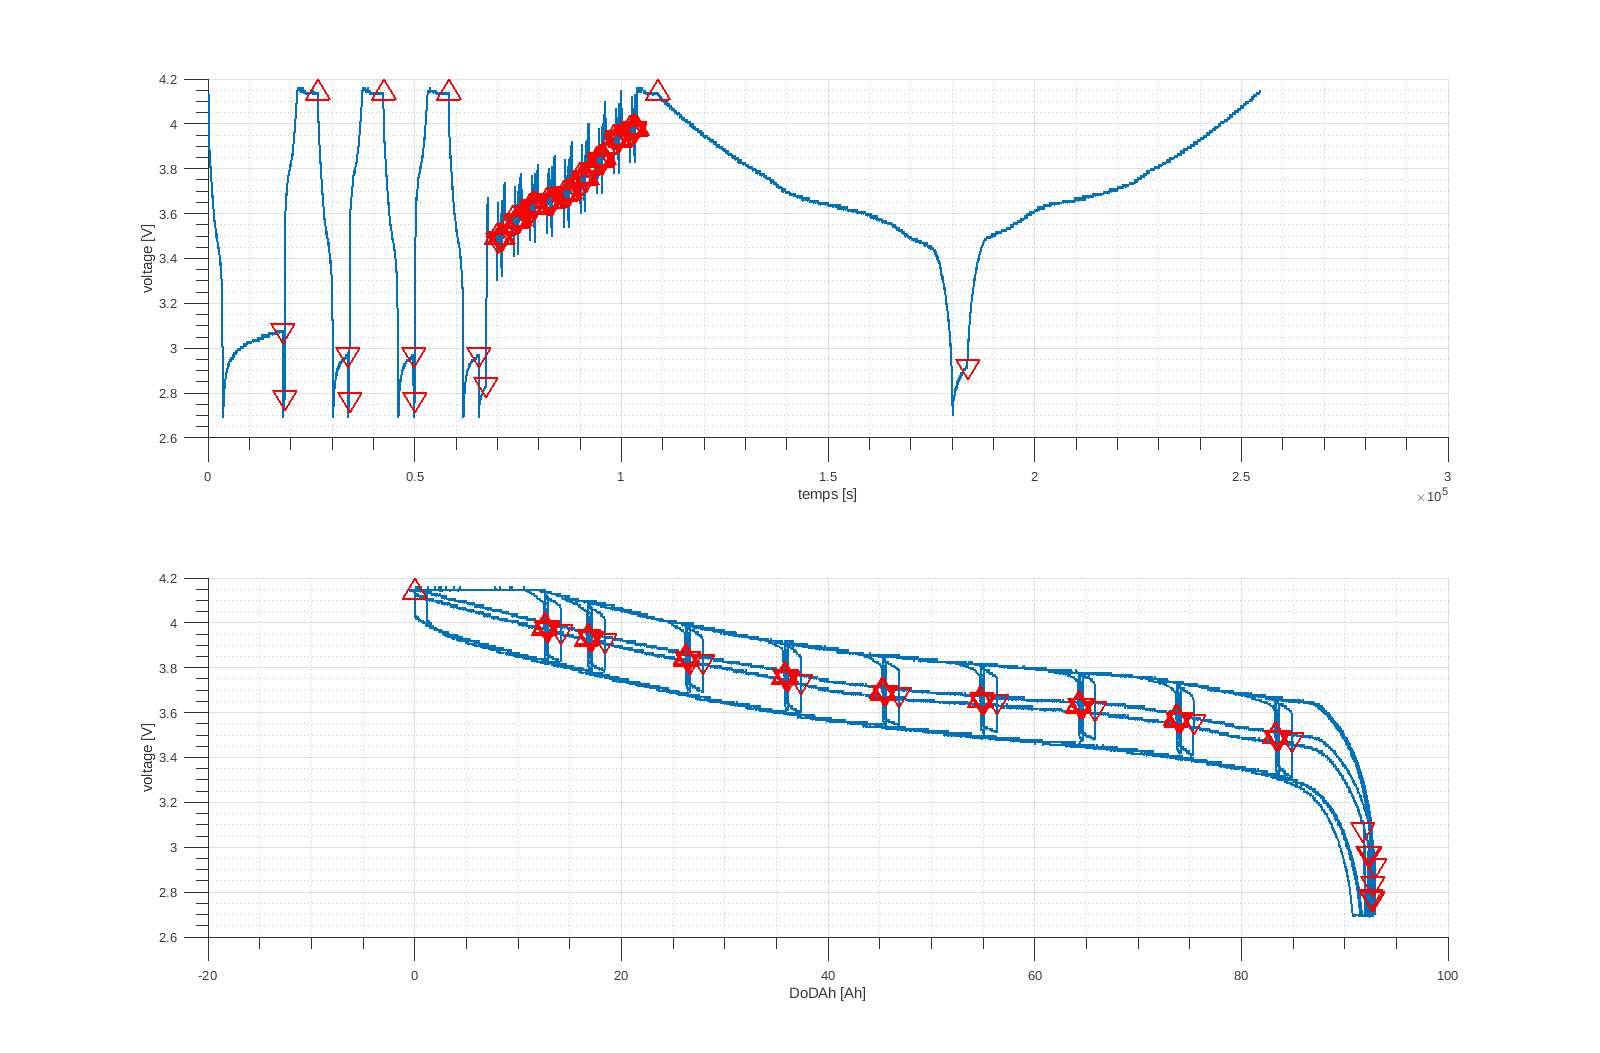
Phases plot
Configuration plot
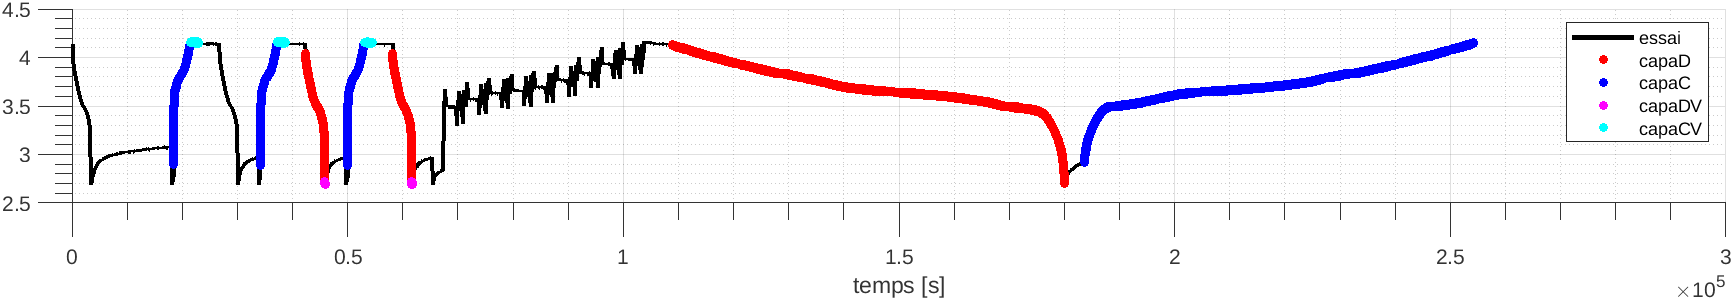
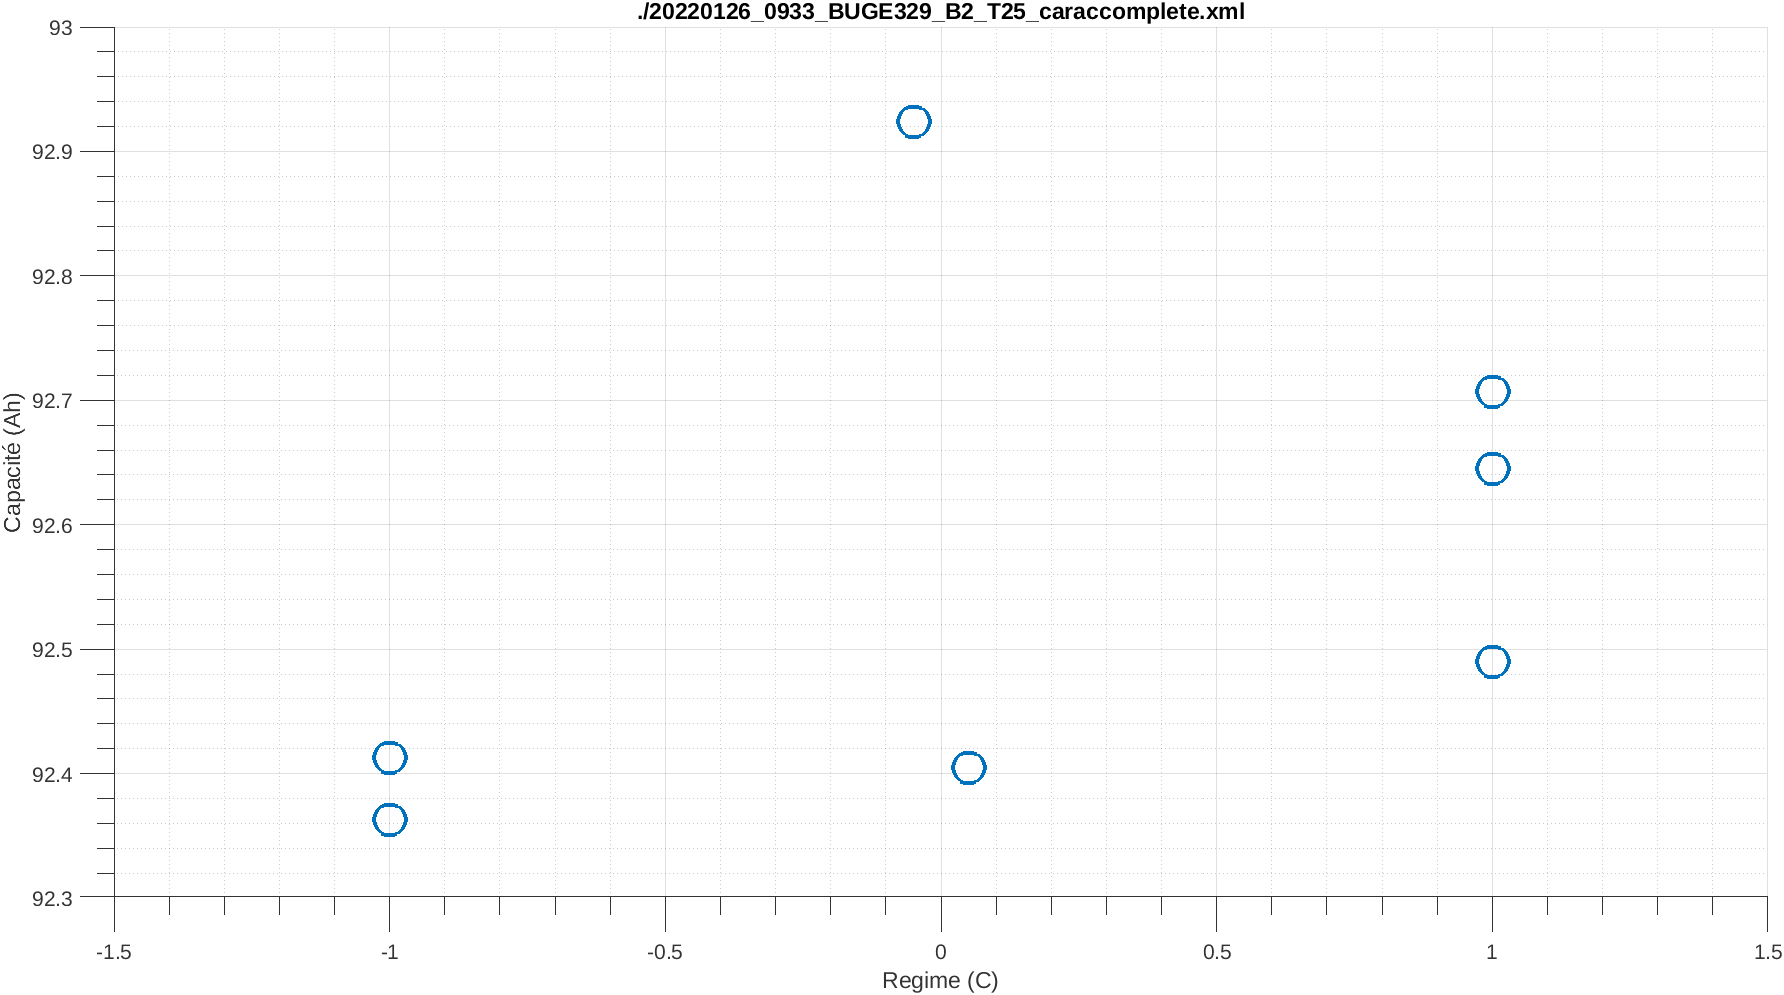
Capacity plot
State-Of-Charge plot
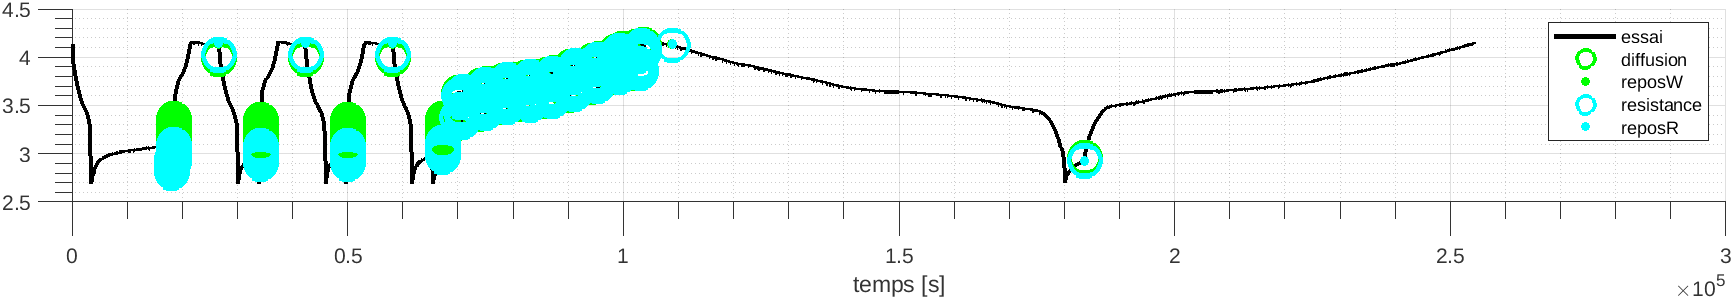
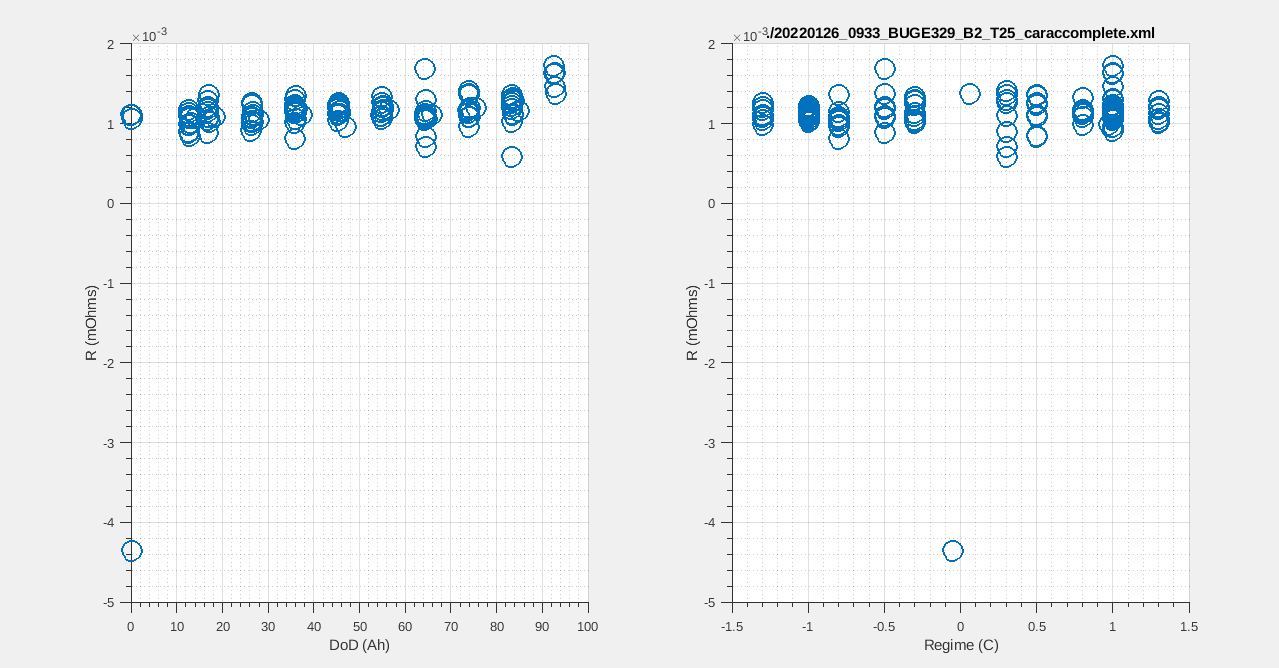
Resistance plot
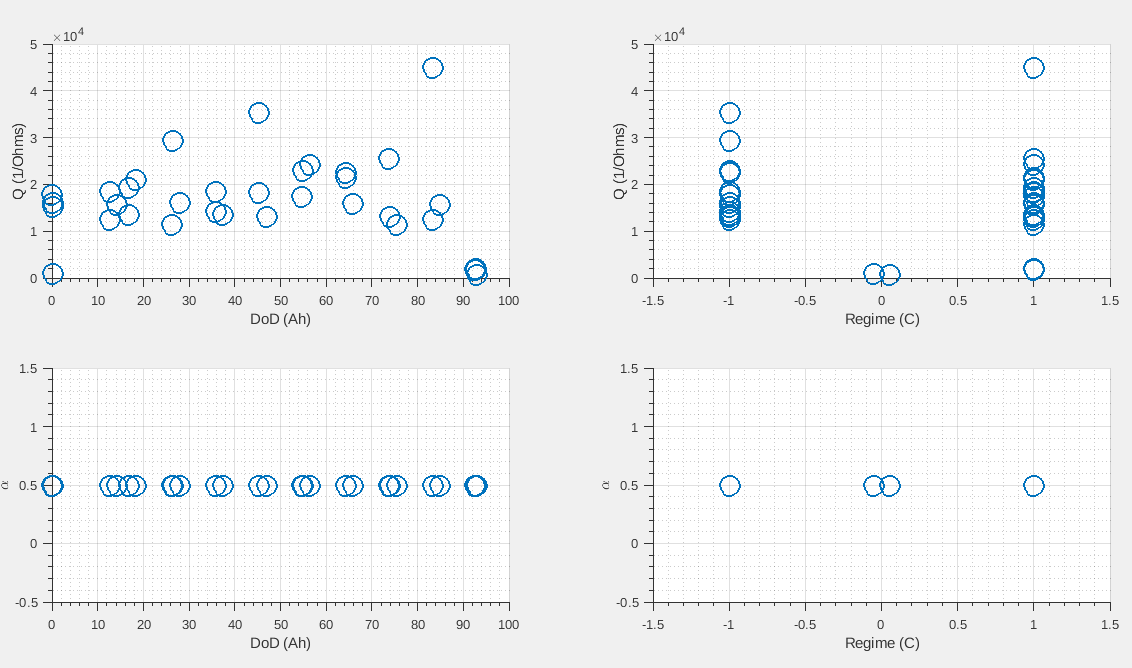
Impedance plot
Open Circuit Voltage plot
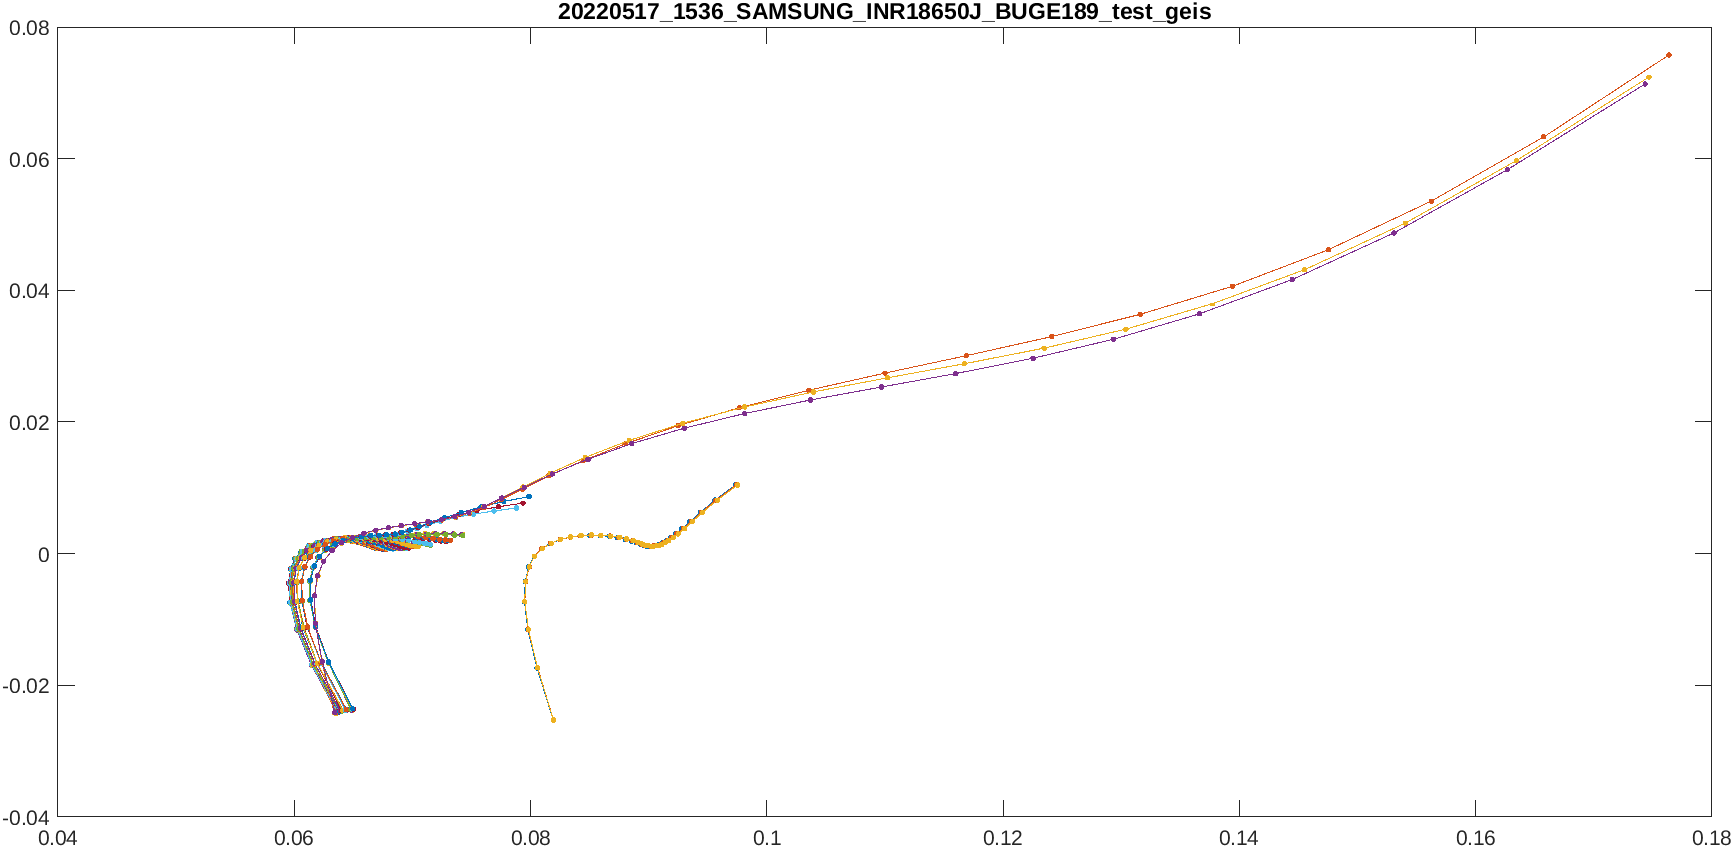
Electrochemical Impedance Spectroscopy plot
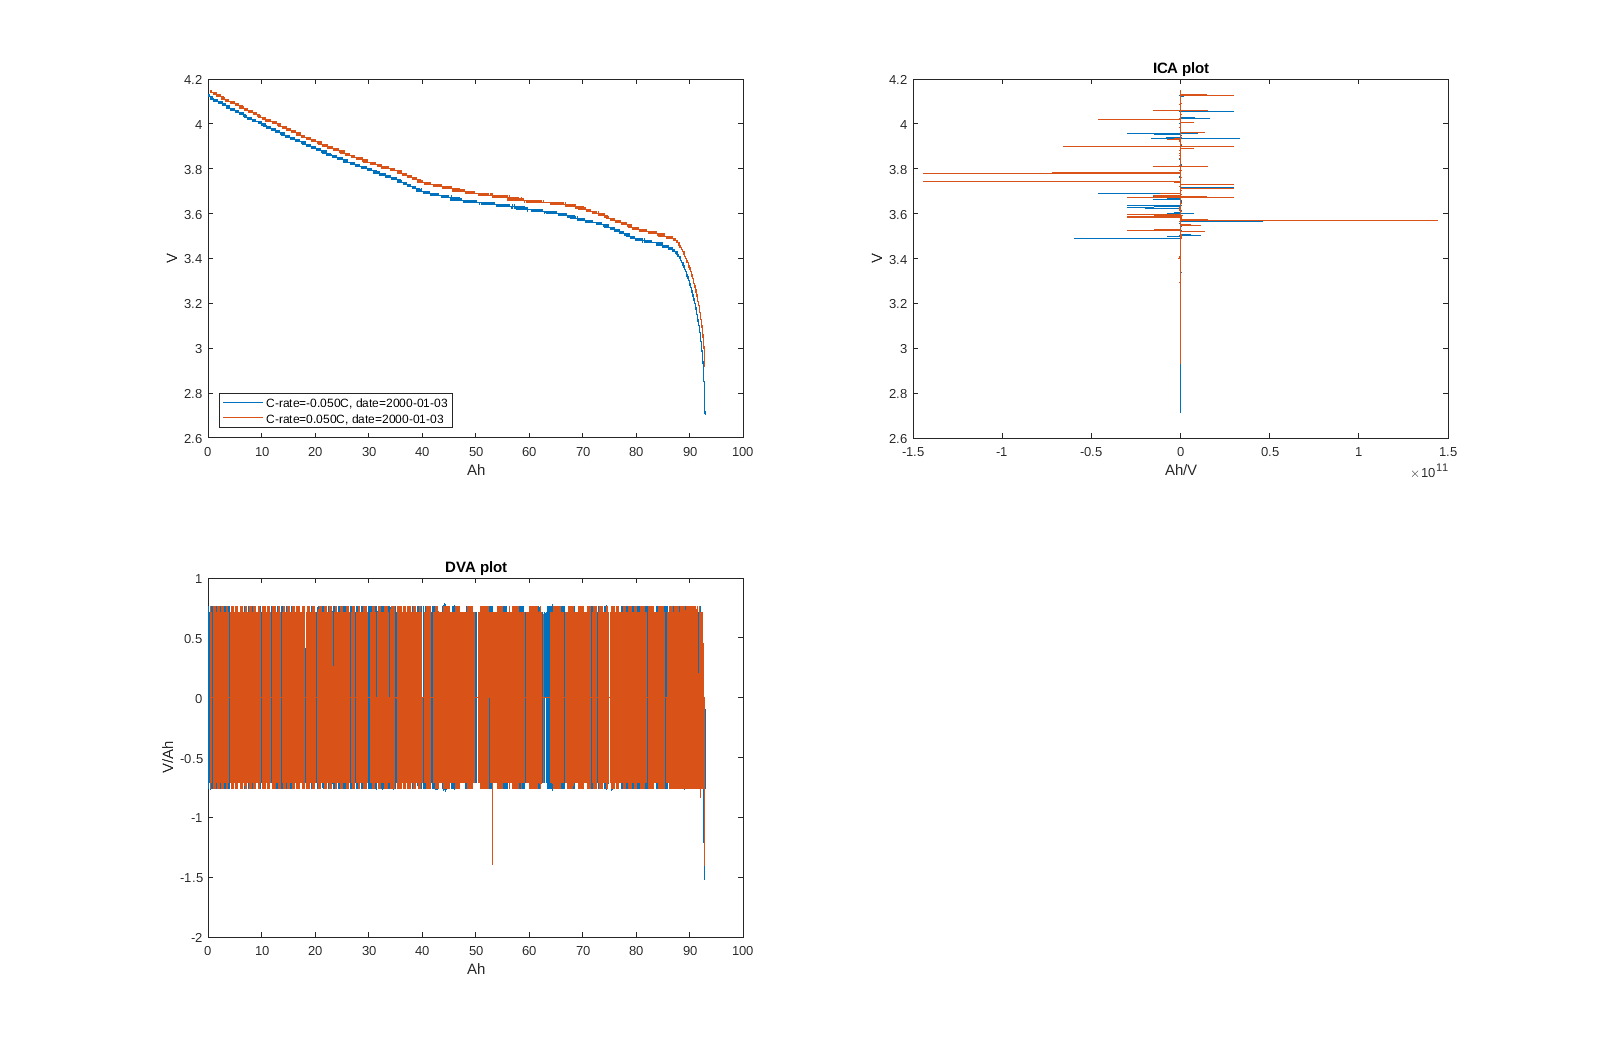
Incremental Capacity Analysis plot