Outline
- Anomaly detection ?
- How to process anomaly detection with DATTES ?
- Methodology and hypothesis
- Contribute to profiles analysis
What is anomaly detection ?
Anomaly detection refers to the identification of unexpected items, events or observations which deviate from the expected behavior. Such data may arouse inconsticency in the experiment, consequently they should be rejected for further analysis.
How to process anomaly detection with DATTES ?
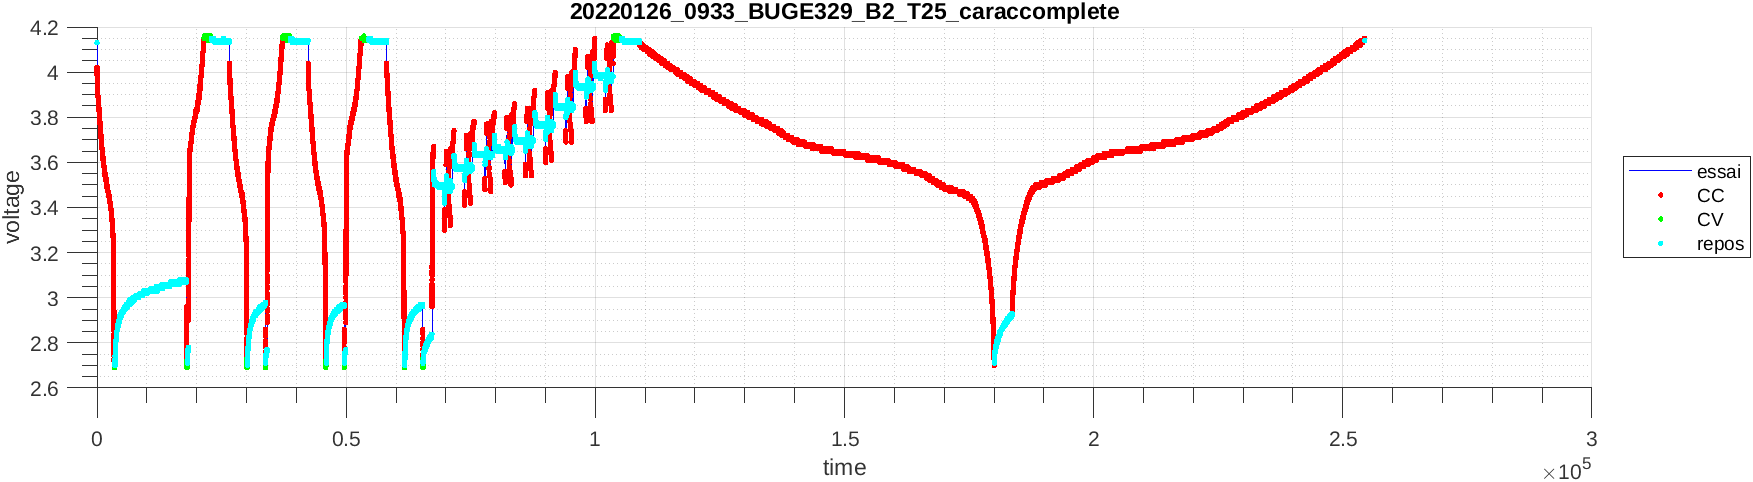
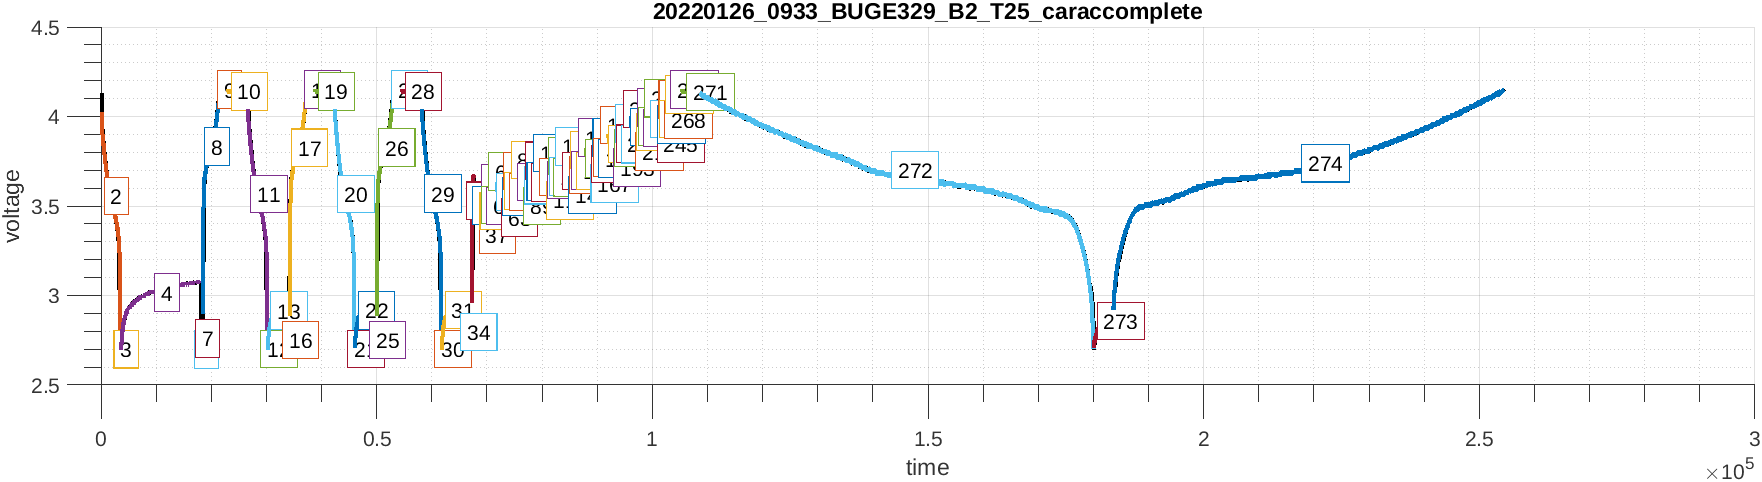
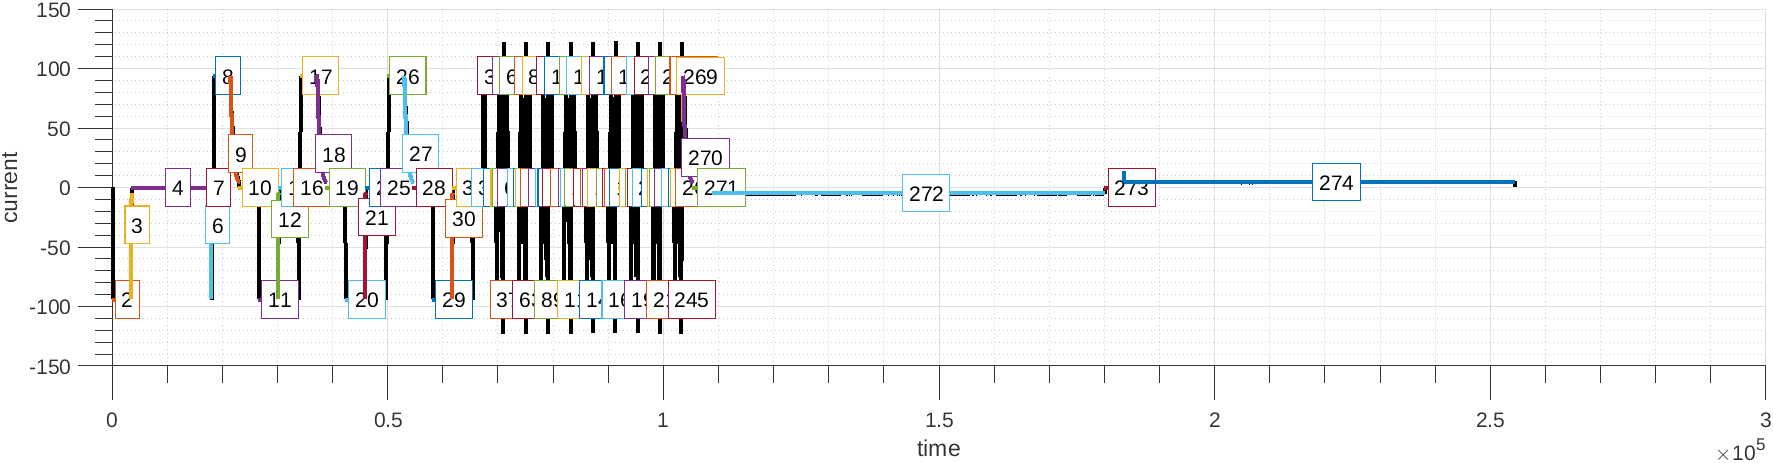
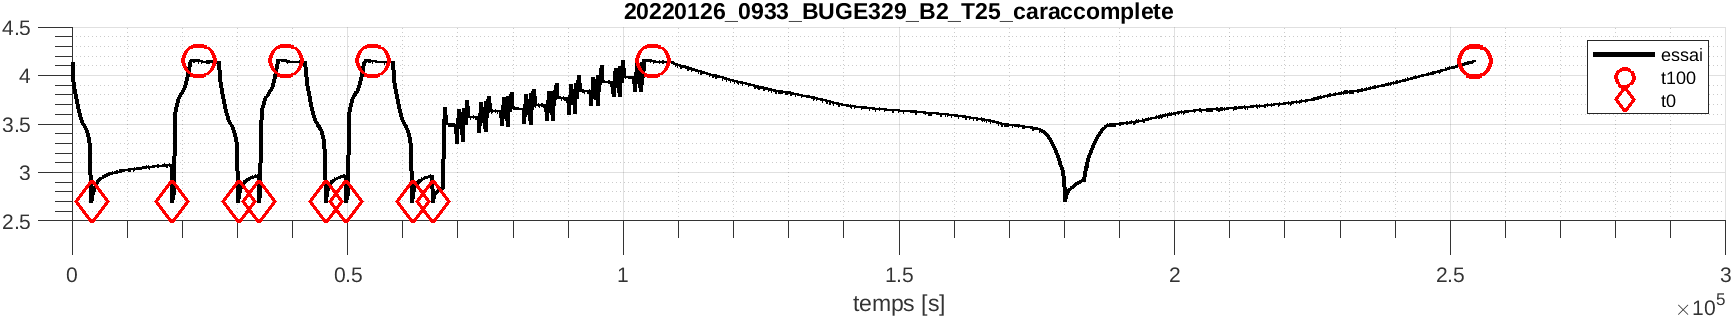
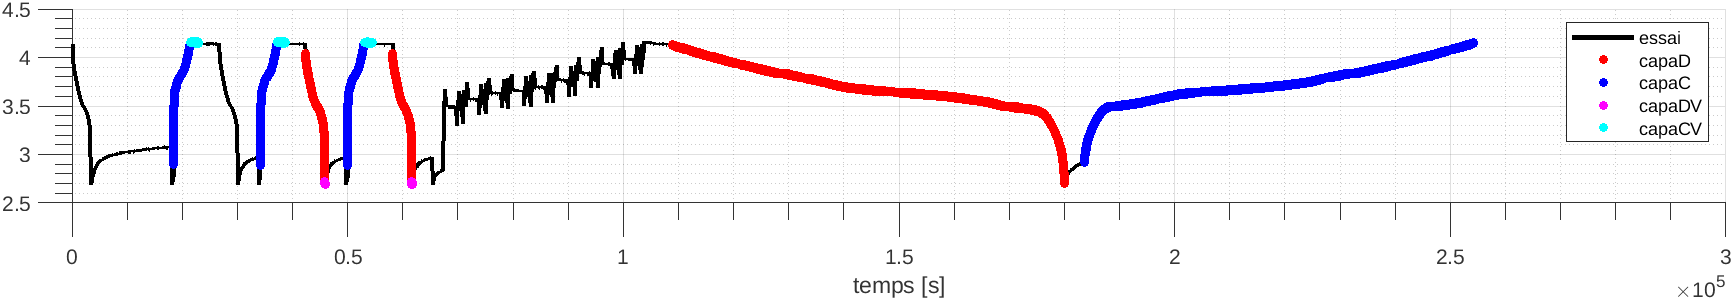
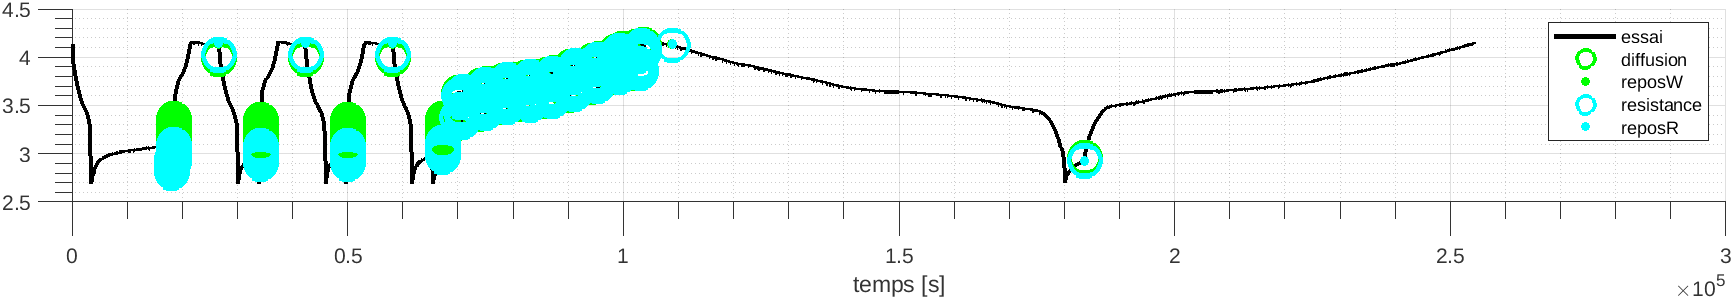
DATTES enables anomaly detection thanks to visual inspection. Profiles and phases can be visualized to check the experiment consistency with expected behavior.
To visualize the test profiles and phases,dattes_plot should be used :
[result, config, phases] = dattes_plot(xml_file,options)
Profile and phases visualization should look like the below figures. In case of an anomaly, some items may be missing.