Outline
- Electrochemical Impedance Spectroscopy definition
- Analysis preparation
- Anomaly detection
- EIS analysis
- Result visualization
- Methodology and hypothesis
- Contribute to eis analysis
Electrochemical Impedance Spectroscopy analysis definition
Electrochemical Impedance Spectroscopy (EIS) is an electrochemical technique to measure the impedance of a system in dependence of the AC potentials frequency.
Analysis preparation
DATTES is called as follows : [result]=dattes(XML_file,'action','configuration_file').
Before any analysis, it is then necessary to create the XML and configuration files.
The section Import cycler files explains how to create the XML file.
The section Create a configuration file explains how to create a configuration file.
Anomaly detection
##Electrochemical Impedance Spectroscopy analysis
To analyze the electrochemical impedance spectroscopy tests, the action ‘c’ should be used :
[result] = dattes(XML_file,'cvs','cfg_file');
The outputs will be :
| Output field | Array | Unit | Description |
|---|---|---|---|
| result | eis | t |
s |
| result | eis | U |
V |
| result | eis | I |
A |
| result | eis | m |
|
| result | eis | ReZ |
Ohm |
| result | eis | ImZ |
Ohm |
| result | eis | f |
Hz |
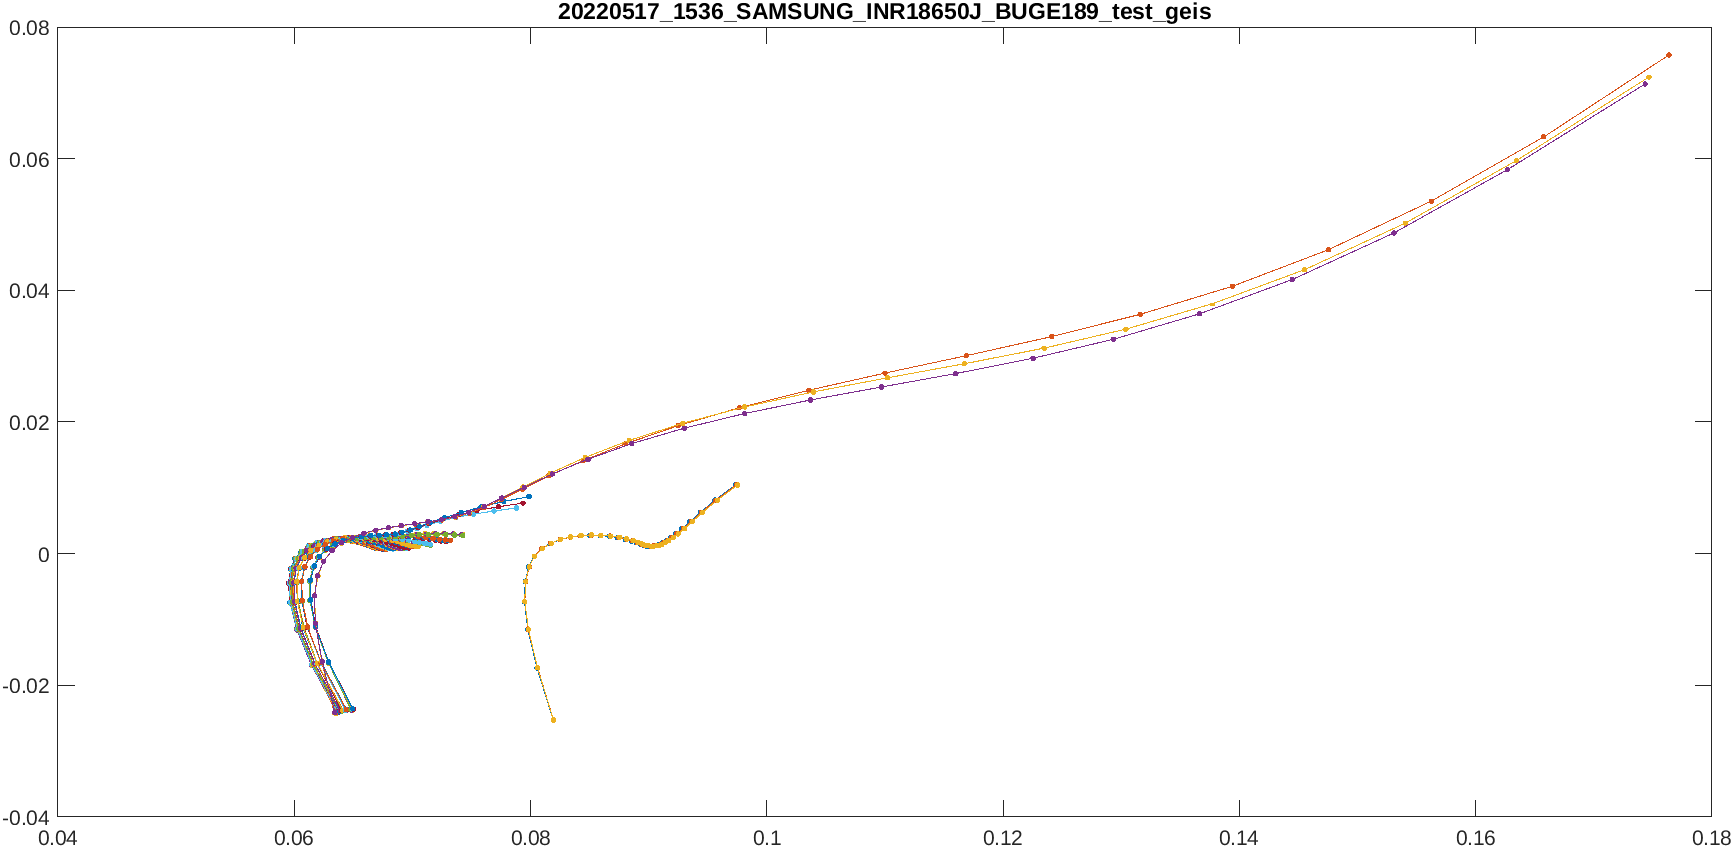
Code for vizualization
To visualize the electrochemical impedance spectroscopy, the action ‘Ge’ should be used :
[result] = dattes(XMLfile,'Ge');
The graph should look like
Methodology and Hypothesis
Method
EIS is processed in function extract_eis from extract_profiles
Key quantities for the calculation
The two key parameters for the identification of the eis are :
- config.test.Uname,
- config.test.Tname.
Assumptions and possible simplifications
No major assumptions or simplifications have been made
Contribute to eis analysis
A list of open issues related to eis calculation and visualization may be available here